Square
Following
Hot
News
Notifications
Profile

CryptoJourney1

vip
Daily chart analysis on BTC, ETH, and altcoins. Levels, patterns, and context. Follow for insights. Trade at your own risk."
Peak Tier VIP 00.3 Year(s)
3
Following
5.3k
Followers
5.6k
Liked
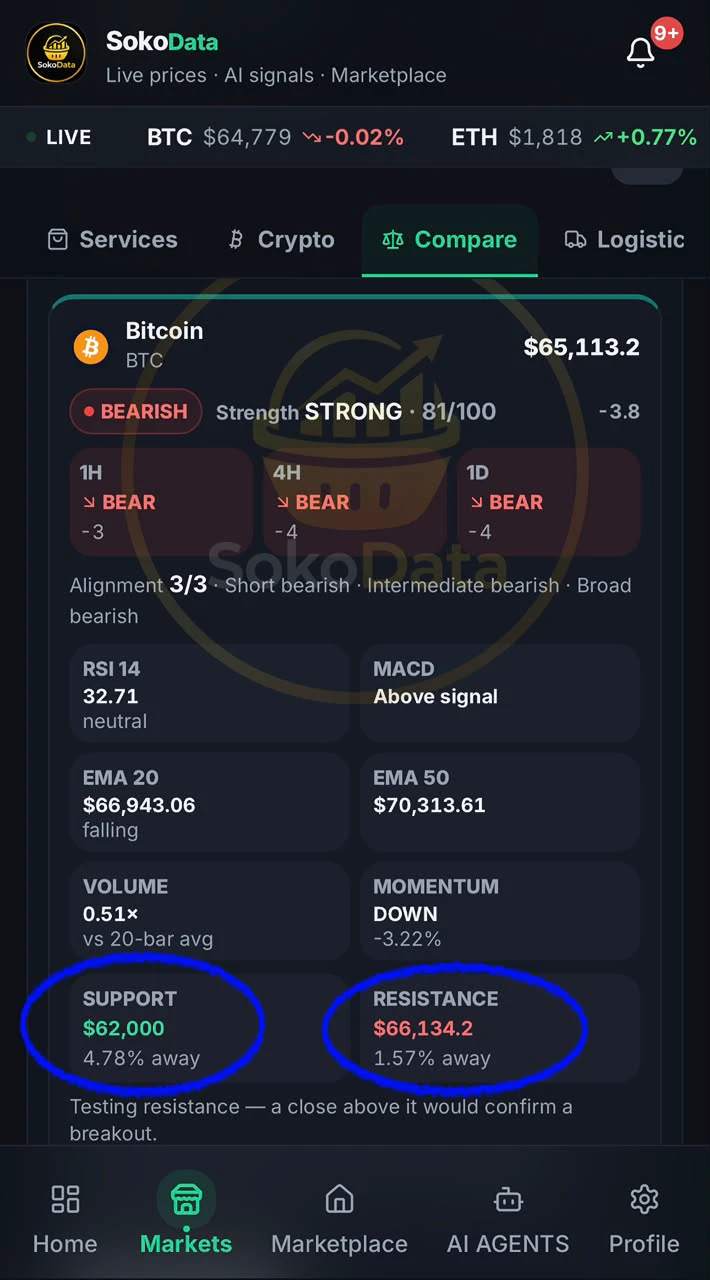
Why they laugh at me when I say Bitcoin won’t trade below 60K?

Here a reason SokoData is telling me a lot about how the market structure is going to turn into Bullishness.

Are you here understand how to use analytical tool known as SokoData?
post-image
BTC-0.67%
Reasons why you need to know how to use SokoData tool.

Our target is 63K.

Let me show you exactly why you need this. Look at the proof on the screen. The system evaluated 7 recent forecasts and got 6 of them correct. That is an 85.7% accuracy rate with an average error of just 1.78%.

Back on Nov 5, it predicted a drop to $80,073. The actual price crashed to $71,712. It nailed the calls on Nov 8, 9, 10, and 11.

Right now, BTC is at $68,796. The engine is flashing a massive 90/100 Bearish confidence. Every single timeframe is pointing down. We are sitting in an accumulation cycle, down 43.17
BTC-0.67%
  • 1
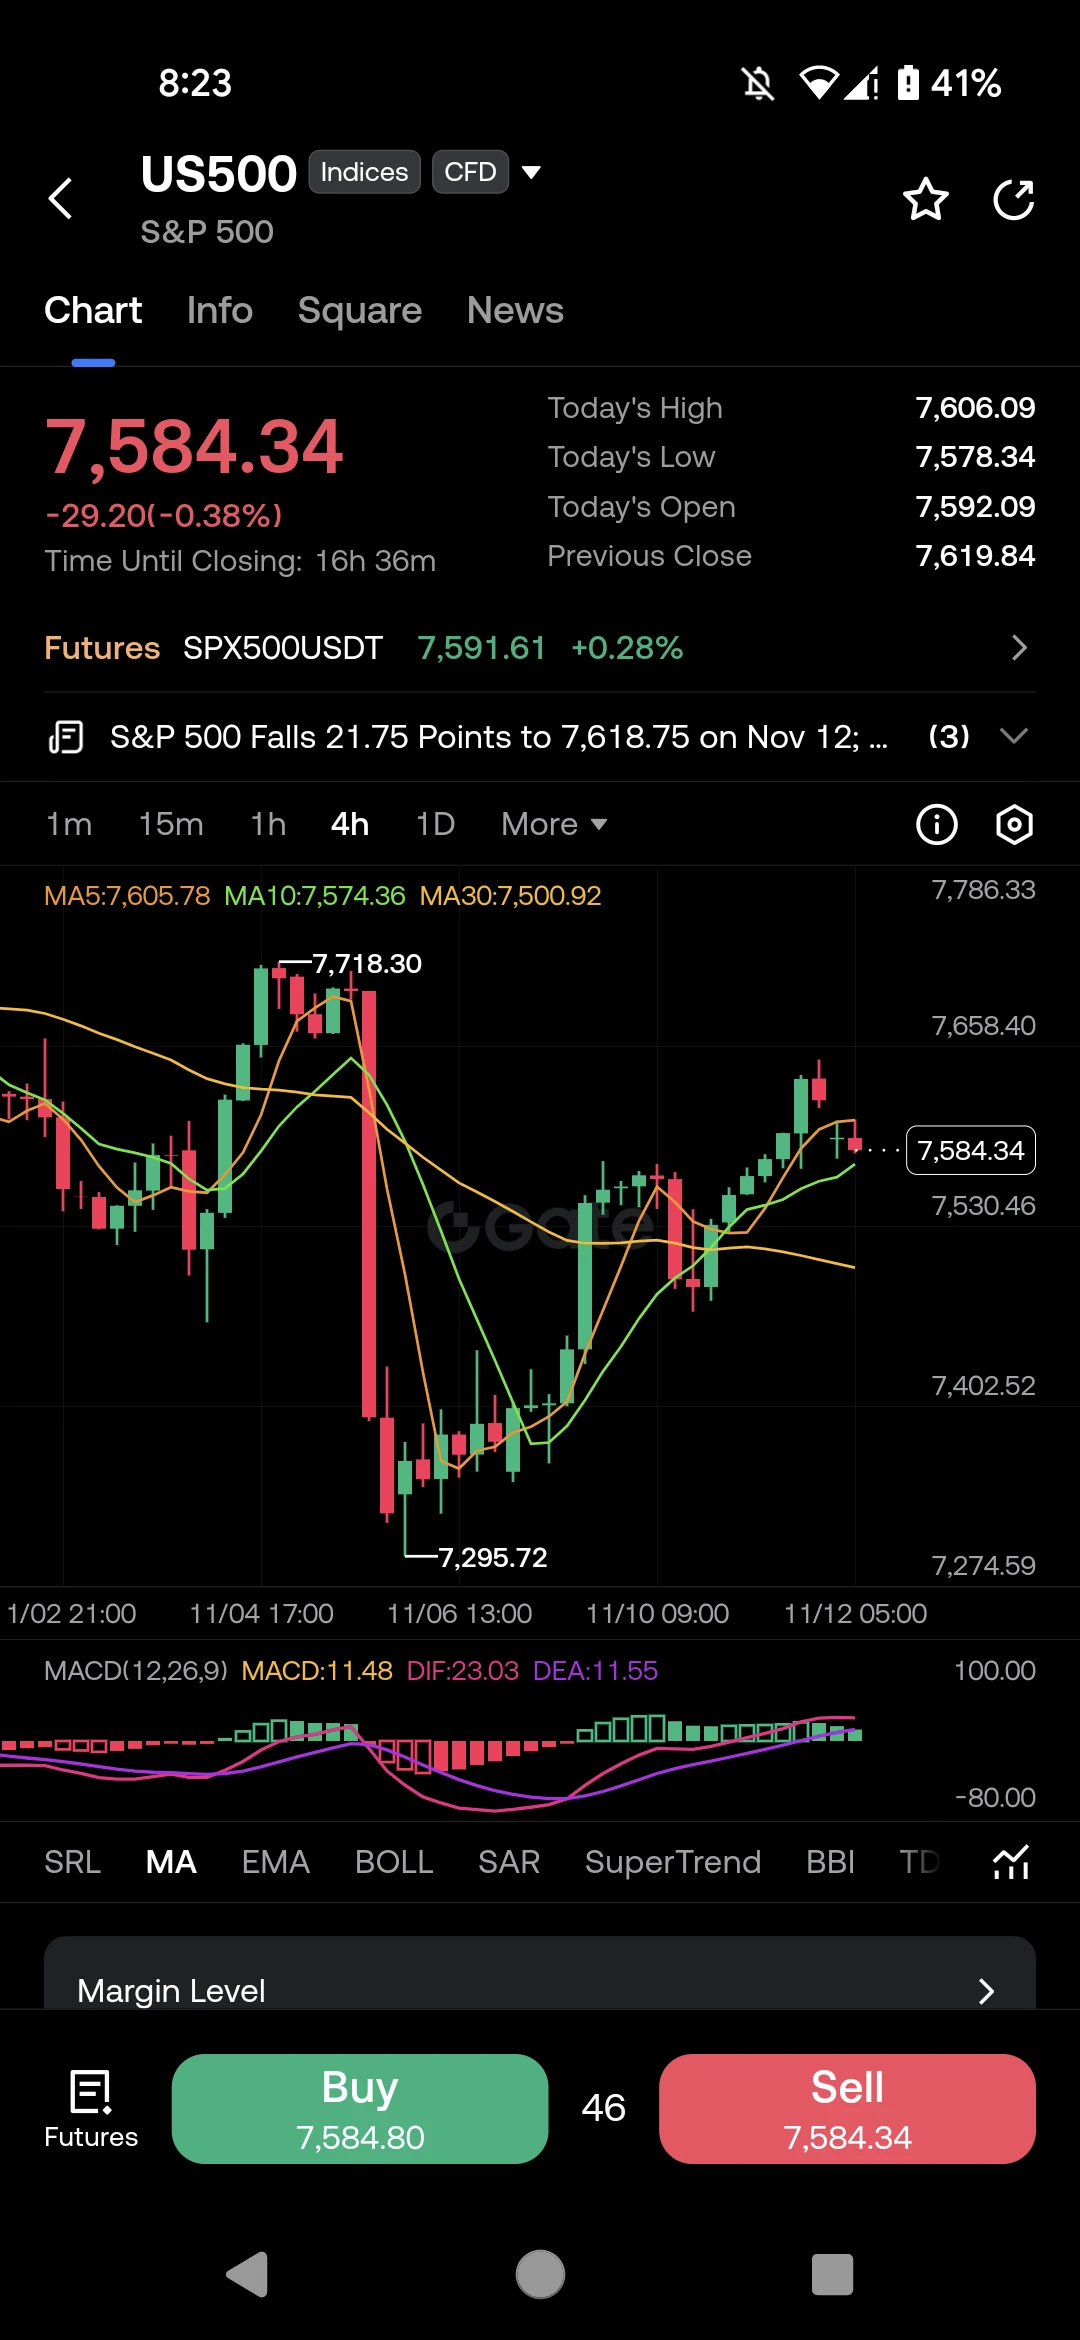
$US500 ‌Pullback: Testing the MA10 Support Zone"

The S&P 500 is facing some selling pressure today. US500 is currently trading at 7,584.34, down -0.38% as the market digests recent gains.

Let us look at the technicals on the 4H chart:

· The Trend: After a massive recovery from the 7,295 low, the index hit a local peak near 7,718 and is now pulling back.
· Moving Averages: The price is currently testing the MA10 (7,574), which is acting as immediate support. It has slipped below the MA5 (7,605), but the MA30 (7,500) remains a strong floor below.
· MACD: The indicator is positive at 11.48, b
post-image
US500+0.00%
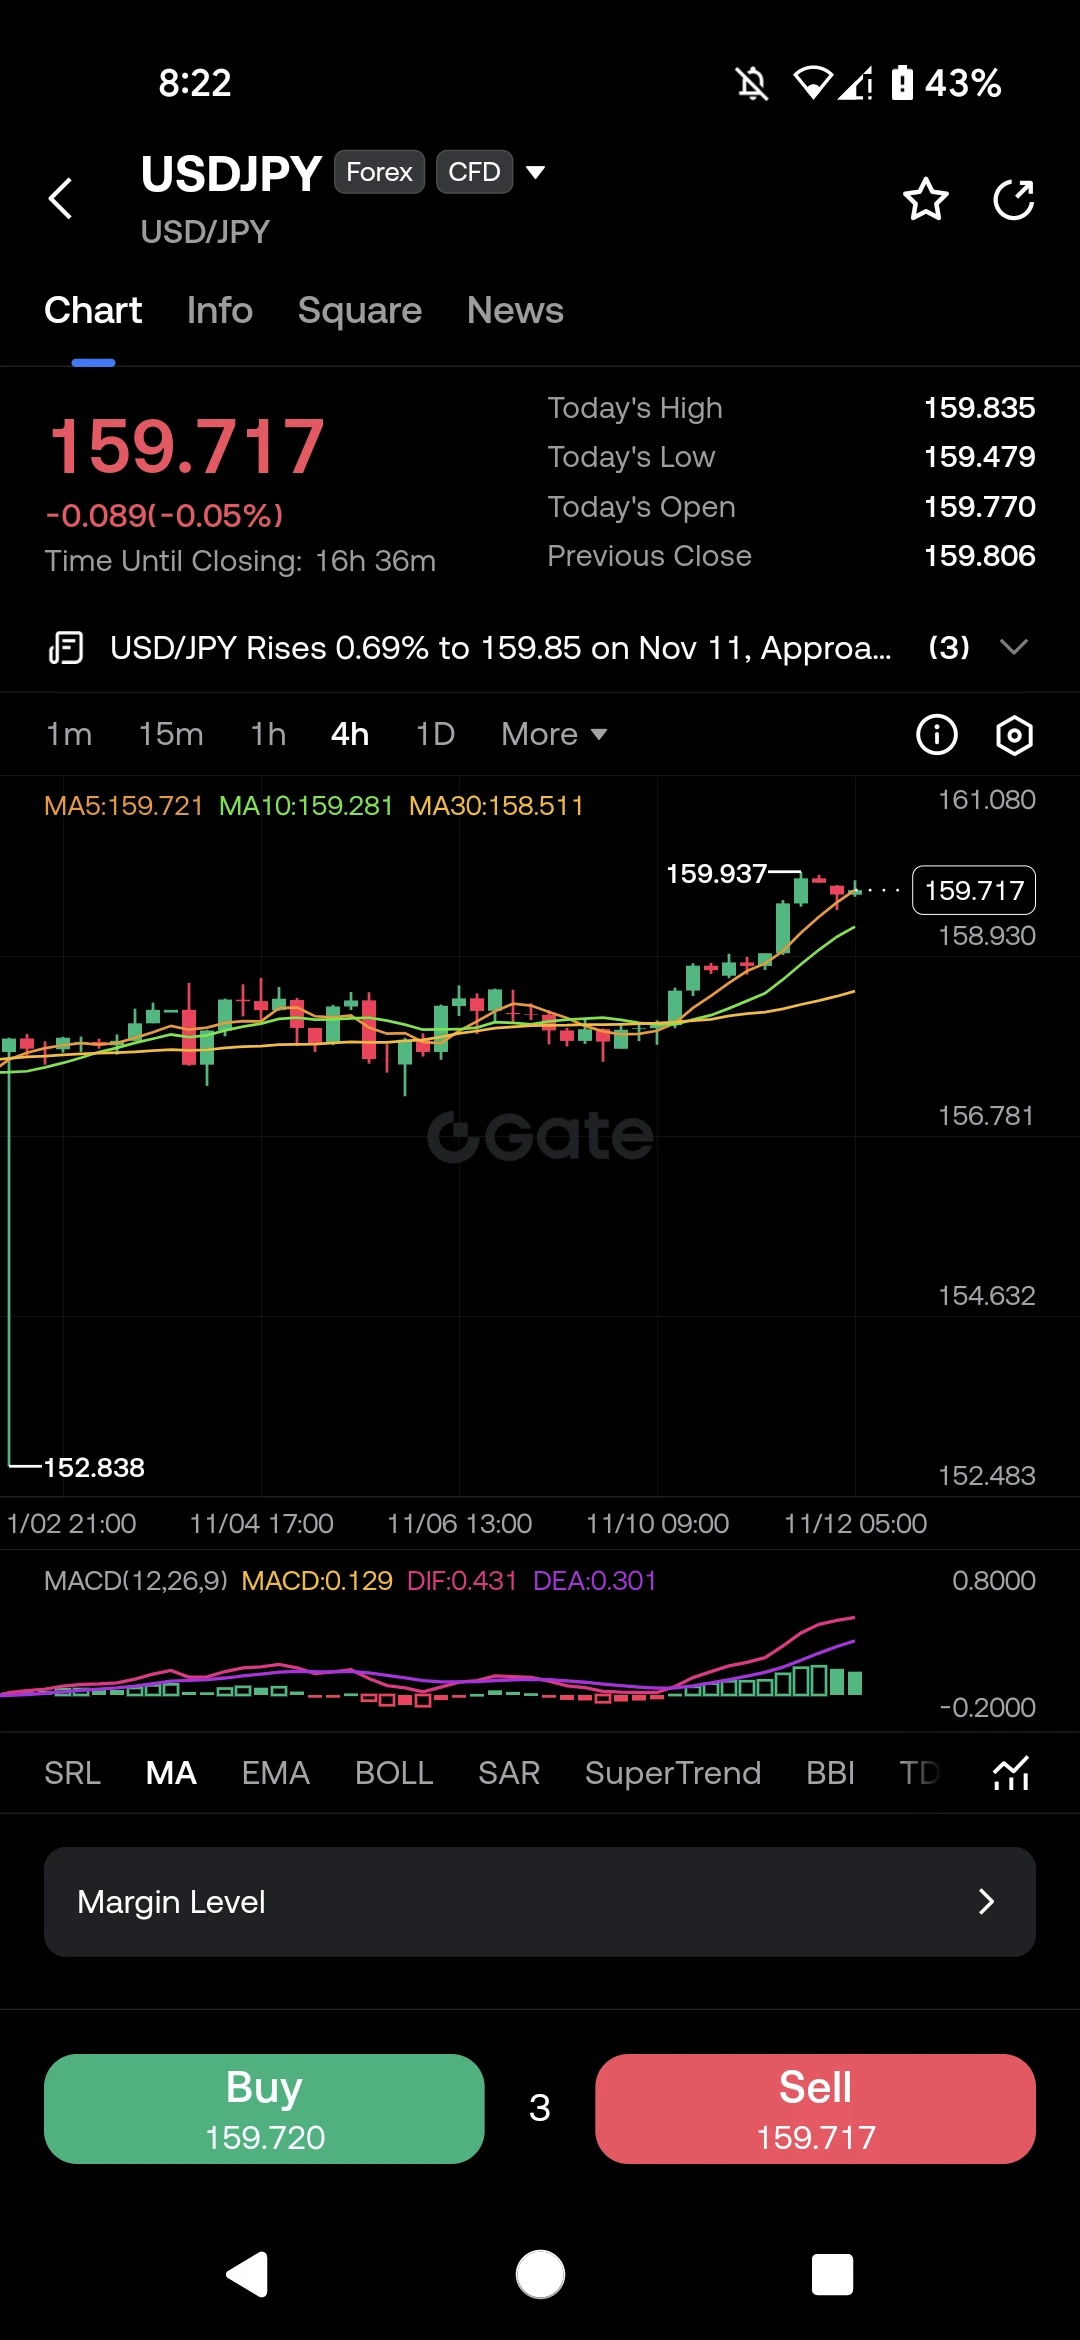
$USDJPY Eyes the 160.000 Level: Breakout or Rejection?"

The US Dollar is showing incredible strength against the Japanese Yen. USDJPY is currently hovering at 159.717, taking a brief pause after a massive run-up to 159.937.

Let us break down the 4H chart:

· The Trend: The price action is purely bullish. We have formed a strong staircase pattern from the 156.780 support zone.
· Moving Averages: The chart is in a perfect bullish alignment. The price is resting right on the MA5 (159.721), with MA10 at 159.281 and MA30 at 158.511 acting as strong dynamic support levels below.
· MACD: The indic
post-image
USDJPY+0.00%
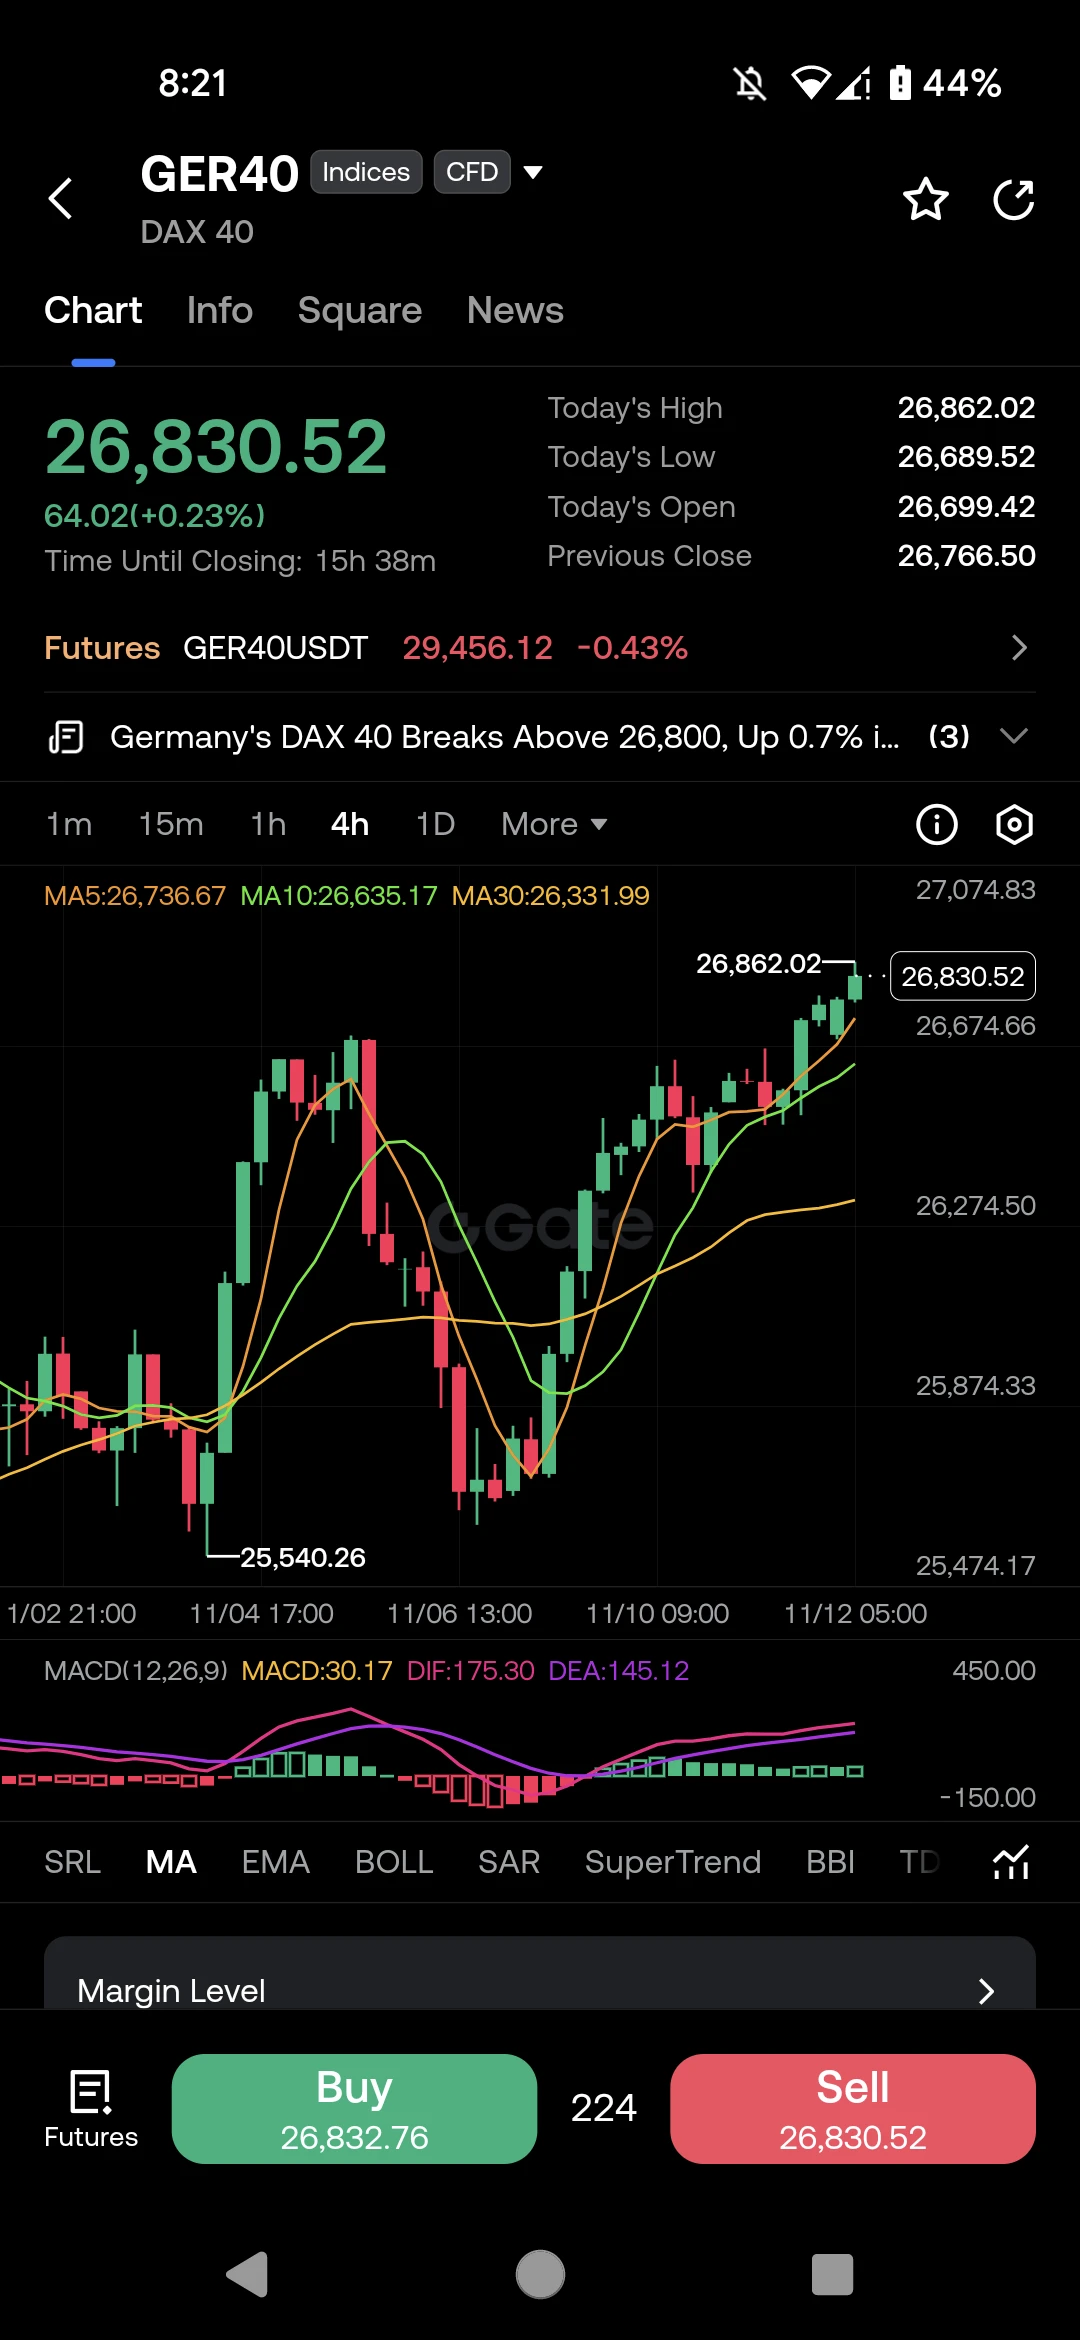
$GER40 ‌ (DAX) Breaking Out: Is 27,000 the Next Target?"

The German DAX is showing massive strength today! GER40 is currently trading at 26,830.52, up +0.23%, and it just broke above a major resistance zone.

Let us look at the technicals on the 4H chart:

· The Trend: Price has recovered beautifully from the 25,540 low, forming a strong staircase pattern.
· Moving Averages: The price is riding above the MA5 (26,736) and MA10 (26,635), with the MA30 far below at 26,331. This is a textbook bullish alignment.
· MACD: Positive at 30.17 with the DIF crossing above the DEA. The momentum is clearl
post-image
GER40+0.00%
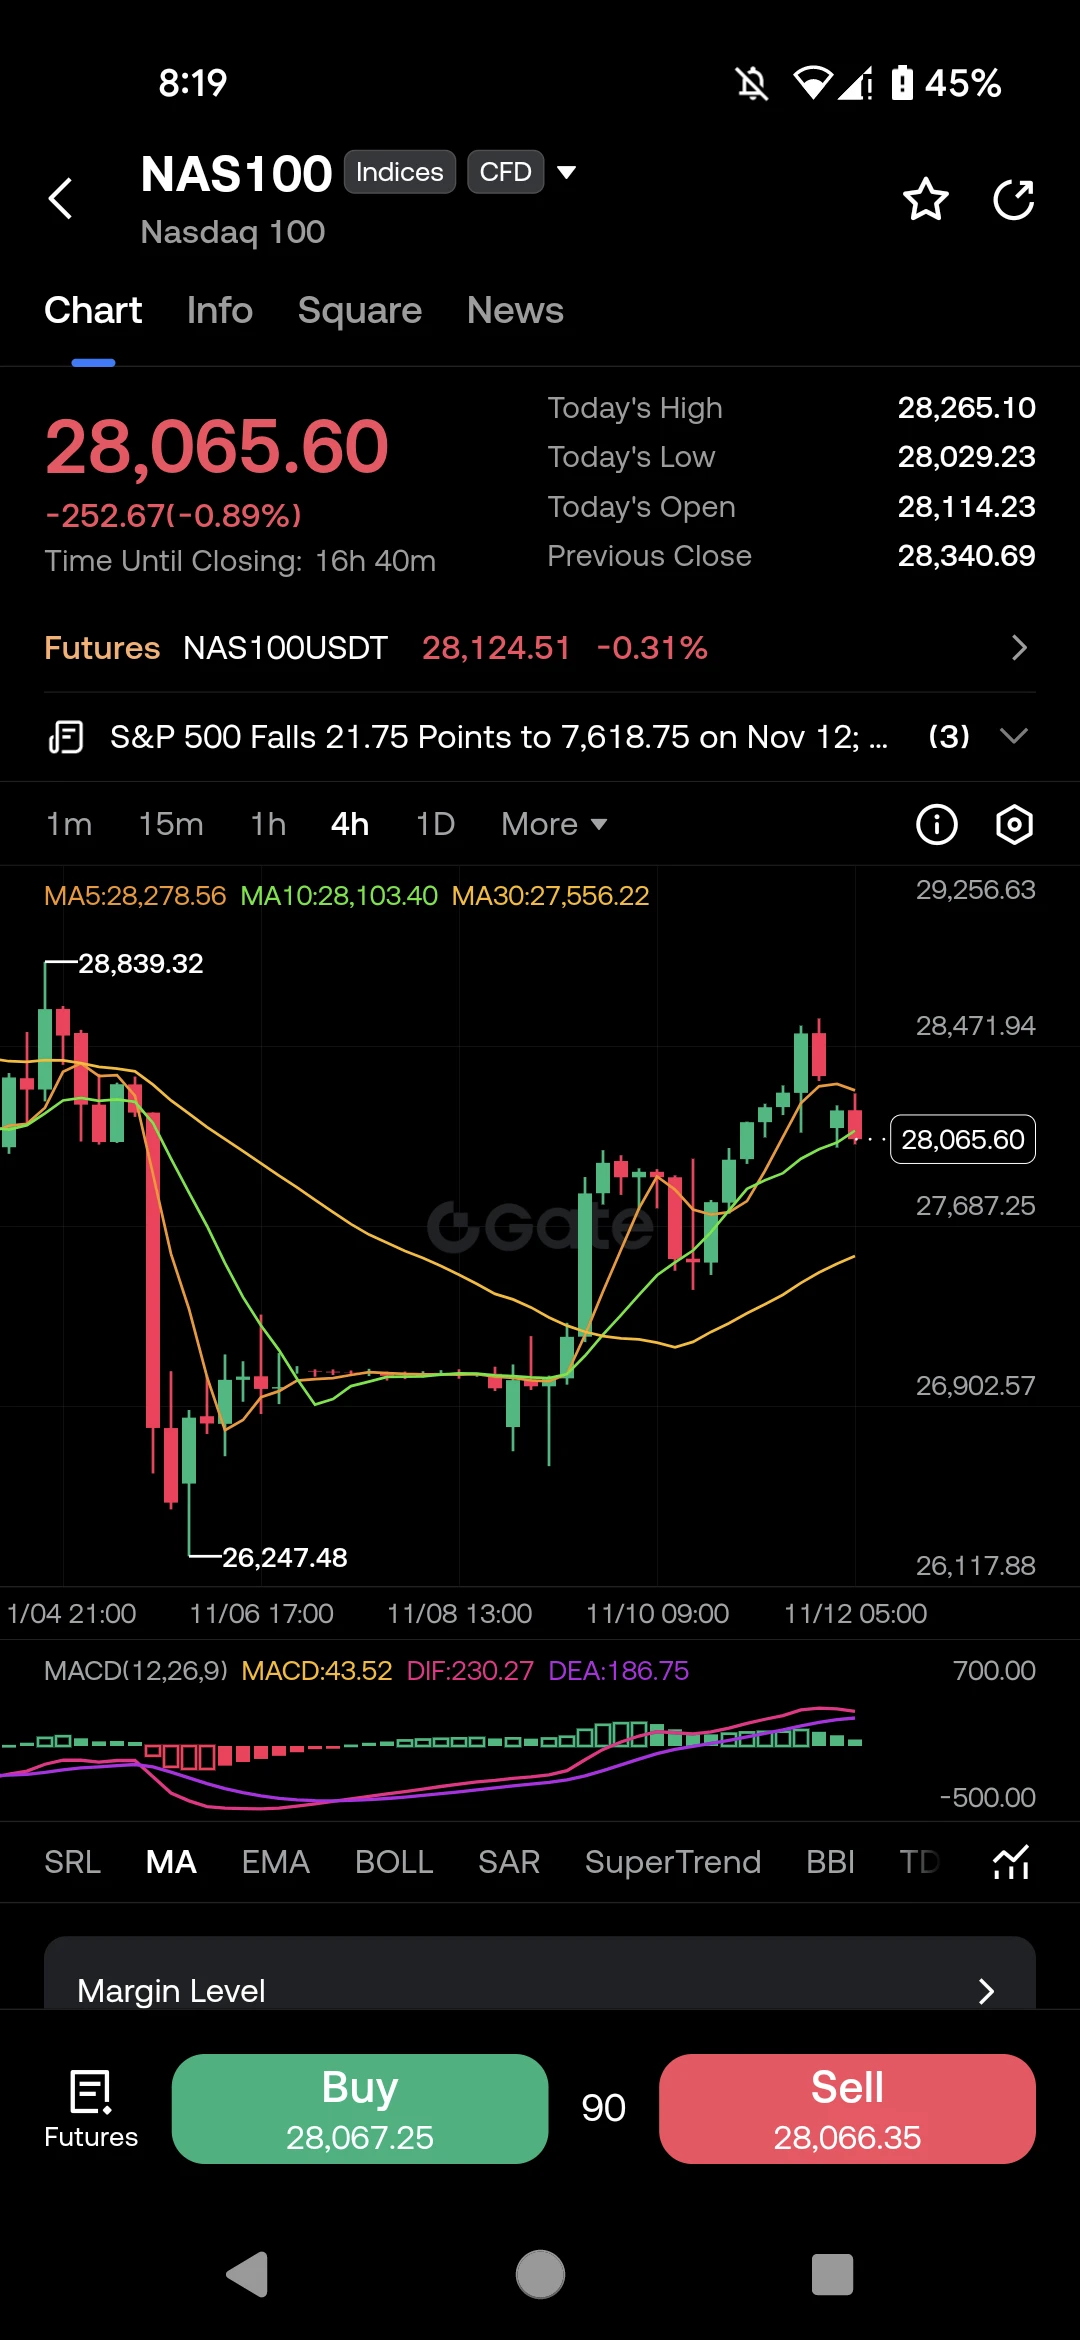
$NAS100 ‌ Pulls Back: Is This Just a Healthy Correction?"

The tech rally is taking a breather today. NAS100 is currently trading at 28,065.60, down -0.89% after a massive run-up from the 26,200 lows.

Let us look at the technical picture on the 4H chart:

· The Trend: The price hit a local peak near 28,839 and is now pulling back.
· Moving Averages: We just broke below the MA5 (28,278) and we are testing the MA10 (28,103). The MA30 remains far below at 27,556, which is a strong long-term support.
· MACD: Still positive at 43.52, but the histogram is shrinking. This indicates that the bullish
post-image
NAS100+0.00%
  • 1
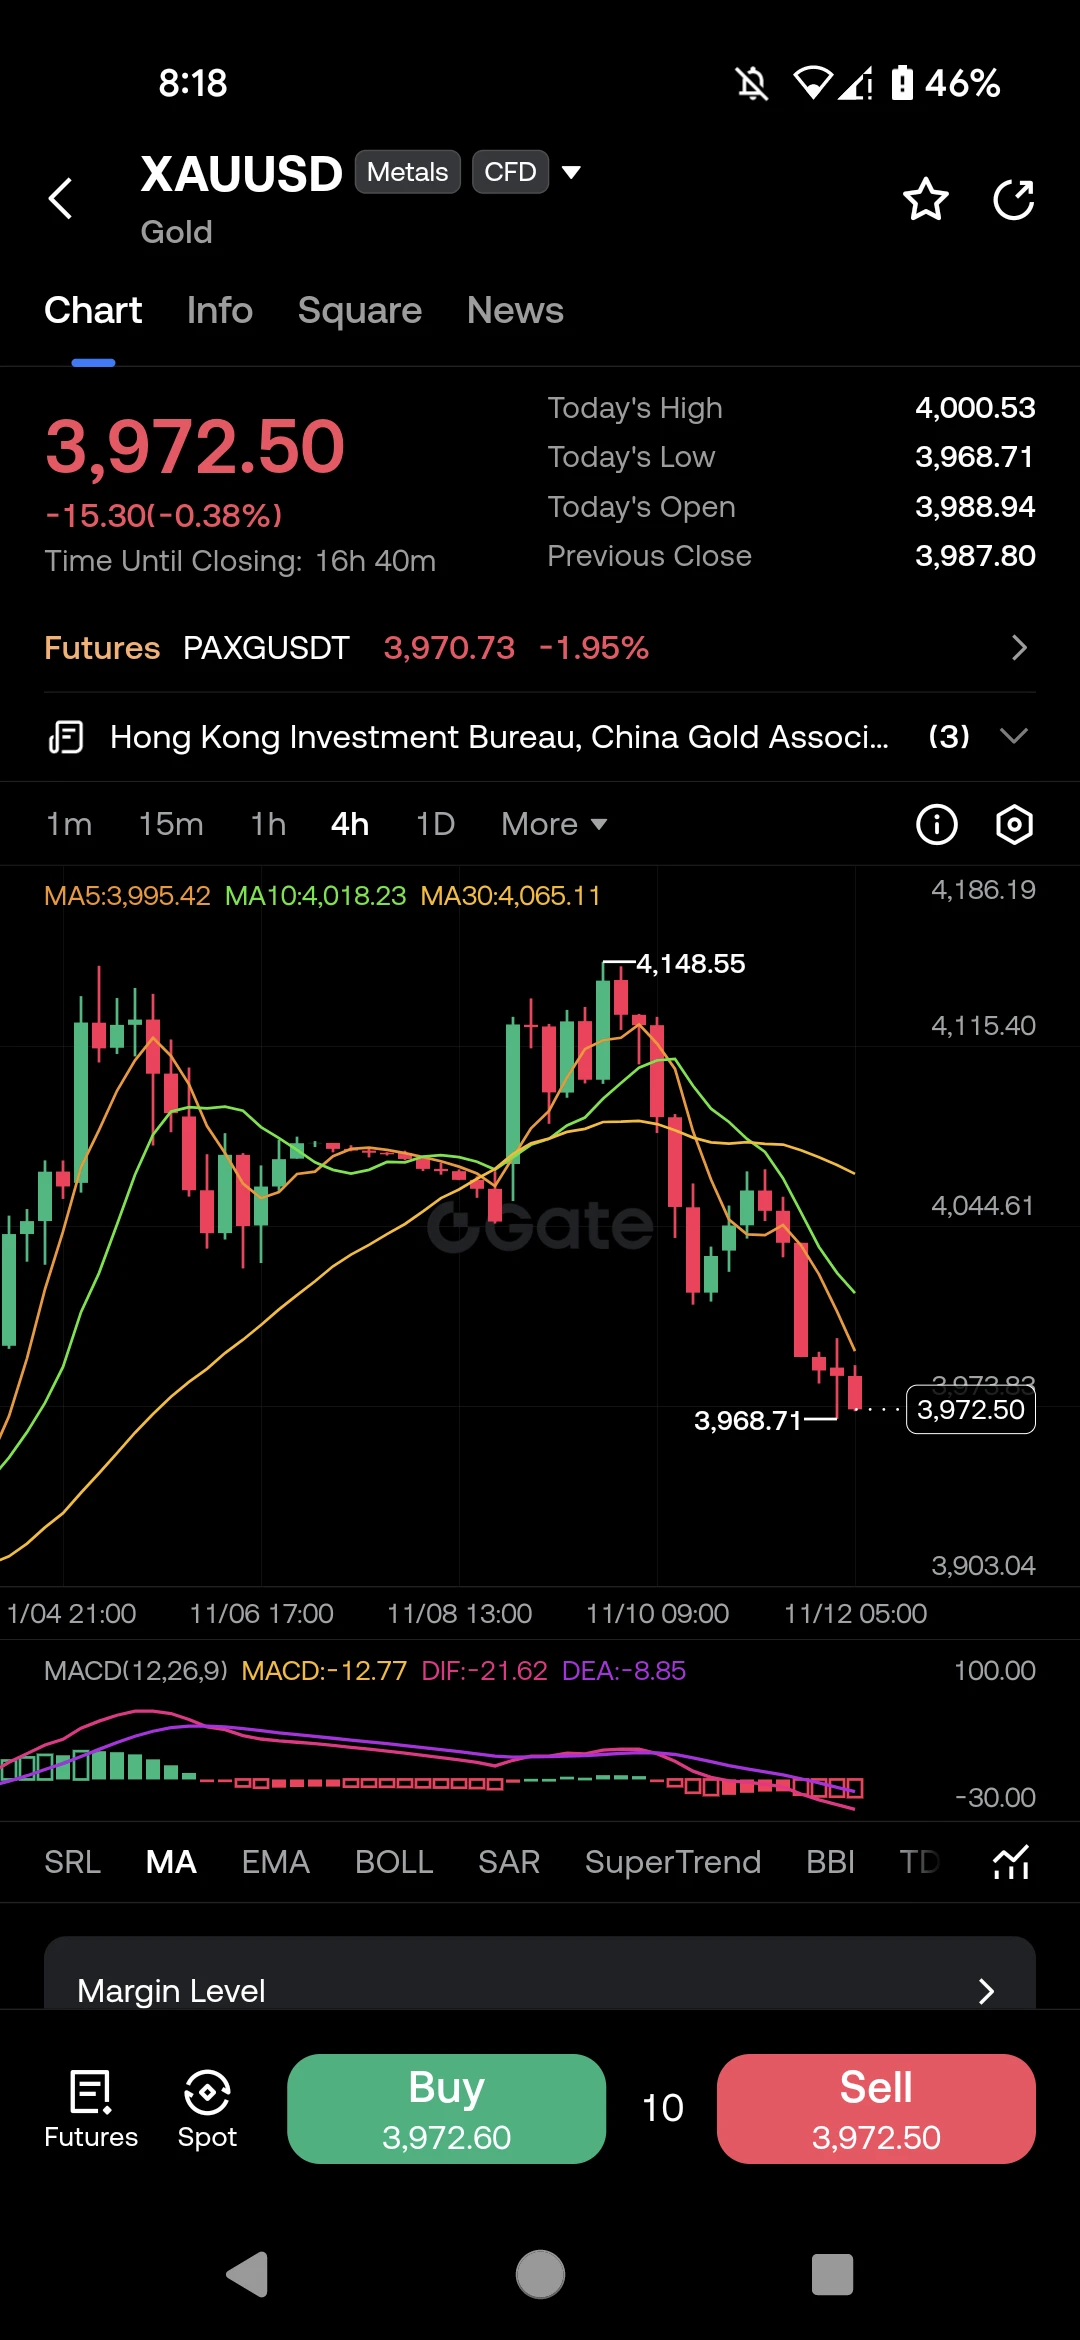
"Gold ($XAUUSD ) Under Pressure: Will the $3,968 Support Hold?"

Gold is bleeding today. XAUUSD is currently trading at $3,972.50, down -0.38% as the bears take control of the market.

Let us look at the technical picture on the 4H chart:

· The Trend: Price has dropped sharply from the recent high of $4,148.55.
· Moving Averages: Price is trading below MA5 ($3,995), MA10 ($4,018), and MA30 ($4,065). This is a clear bearish alignment.
· MACD: The indicator is negative (-12.77) and pointing down, confirming the bearish momentum.
· Key Support: Price is testing the intraday low of $3,968.71.

My
post-image
XAUUSD+0.00%
LESSON OF THE DAY: HOW TO SPOT A POST-PUMP TRAP ON INITIA (INIT).
$INIT ‌
If you want to survive in crypto, you need to learn how to read the data, not just chase green candles. Let's use Initia (INIT) right now as a perfect textbook example of a dangerous setup. I want you to look at this and understand why patience is your best weapon.

The system has flagged INIT as a Choppy Market with a Neutral structure and a Redistribution phase. This means the market is unstable, prone to fakeouts, and the smart money is preparing to exit.

Here are the exact numbers you need to pay attention to:

The
INIT-1.74%
  • 1
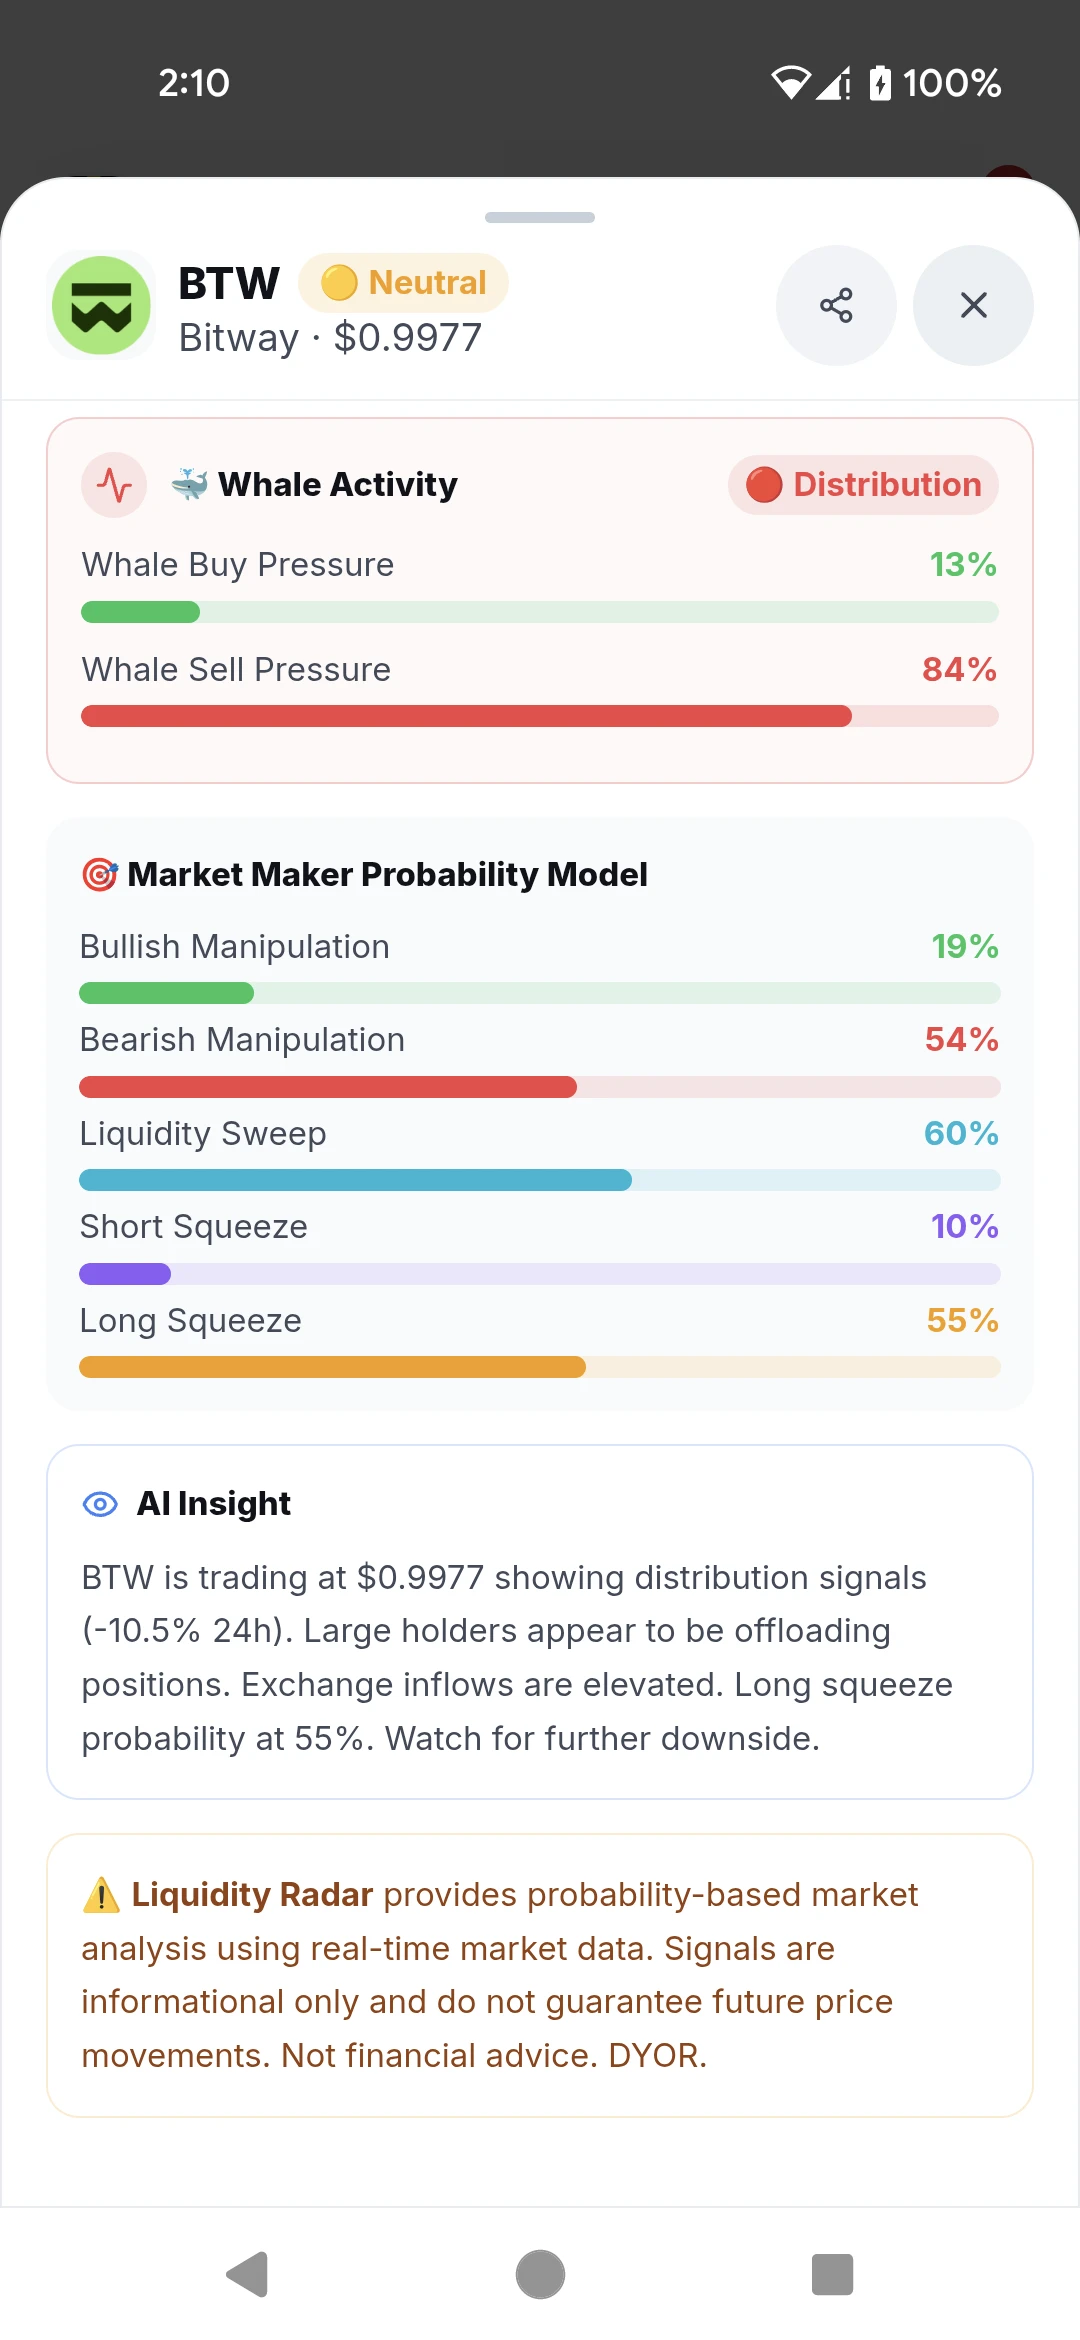
$BTW ‌ WARNING: HEAVY WHALE DUMPING DETECTED AMIDST A NEUTRAL STRUCTURE! 📉

Do not let the "Neutral" market structure tag fool you into thinking this is a safe zone. Bitway (BTW) is currently sitting at $0.9977, down a heavy -10.47%, and the underlying data is screaming danger. The big players are aggressively exiting their positions.

Here is the exact breakdown of the current market conditions:

📊 Market Overview:

· Market Cap: $1.50B
· Volume Change: 0% of Mkt Cap
· Open Interest (OI) Change: -6.4%
· Funding Rate: -1.0000% (Long/Short ratio is a heavily skewed 0.49x)
· Volatility Score:
post-image
BTW-7.75%
  • 1
MASSIVE WHALE ALERT: 100% BUY PRESSURE DETECTED ON PIEVERSE!
$PIEVERSE ‌
Do not sleep on this one. PIEVERSE is absolutely exploding right now, up a massive +23.23% to $2.05. The overall Market Structure is firmly Bullish, but the data beneath the surface is what really caught my eye.

Let's break down the exact numbers because this setup is wild:

Market Overview:

· Market Cap: $562.4M
· Volume Change: 27% of Mkt Cap
· Open Interest (OI) Change: +8.1%
· Funding Rate: +1.0000% (Long/Short ratio is 1.66x)
· Volatility Score: A massive 100/100
· Liquidity Score: 85/100

The Whale Activity:

· P
PIEVERSE+0.50%
$XMR ‌ UNDER PRESSURE: HEAVY DISTRIBUTION SIGNALS A FURTHER DROP. 🩸

Do not ignore the red flags on Monero right now. The asset is bleeding at $561.9 after a sharp -5.74% drop, and the overall Market Structure has firmly flipped to Bearish. The big players are exiting their positions fast.

Here is the exact breakdown of the current situation:

📊 The Market Overview:

· Market Cap: $10.58B
· Volume Change: 1% of Mkt Cap
· Open Interest (OI) Change: -3.7%
· Funding Rate: -1.0000% (Long/Short ratio is 0.71x)
· Volatility Score: 30/100
· Liquidity Score: 67/100

🐋 Whale & Maker Activity:

· W
XMR-3.39%
  • 1
$HYPE ‌ALERT: A BEARISH TRAP HIDING BEHIND A GREEN CANDLE? ⚠️

Do not let the +1.31% 24-hour change fool you. Hyperliquid ($HYPE) is currently printing a Bearish market structure, and the underlying data shows a market that is completely stuck in the mud.

Here is the exact breakdown of what is happening right now:

📊 The Market Overview:
· Current Price: $74.96
· **Market Cap:** $17.95B
· Volume Change: 7% of Mkt Cap
· Open Interest (OI) Change: +0.4%
· Funding Rate: +1.0000% (Long/Short ratio is 1.03x).
· Volatility Score: A dead 20/100.
· Liquidity Score: 79/100.

🐋 Whale & Maker Activit
HYPE+0.33%
$XRP ‌ IS SLEEPING IN A BEARISH ZONE! DON'T GET FOOLED BY THE GREEN CANDLE. 🐢

You know that feeling when you look at the charts and the market is just completely dead? That is exactly where XRP is right now.

Yes, it’s showing +0.30% on the 24-hour change, but don’t let that tiny green number trick you. The overall Market Structure is firmly Bearish.

Let's cut through the noise and look at the raw data:
· Current Price: $1.1
· **Market Cap:** $69.94B
· Volume Change: Only 3% of Mkt Cap (The market is asleep).
· OI Change: -0.5%
· Funding Rate: +0.2914% (Long/Short ratio is 0.96x).
· Volati
XRP-1.12%
BONK SIGNAL: THE CHART SAYS BUY, BUT THE DATA SAYS WAIT. ⚠️
$BONK ‌
Don't let the green "Buy" tag fool you into rushing your entry. I was looking at the charts today and pulled up Bonk (BONK). While it’s sitting in a Trending Market (Uptrend) with a Bullish structure, the system is waving a big yellow caution flag.

Here is the exact breakdown of what is happening under the hood:

📊 Market Condition & Stats:
· Phase: Accumulation
· Trend Strength: Moderate
· Volume: Weak
· Momentum: 61/100
· Volatility: Normal
· Risk: Moderate Risk

🛑 Setup Status:
· Status: Not Active
· Position Setup: LON
BONK-2.55%
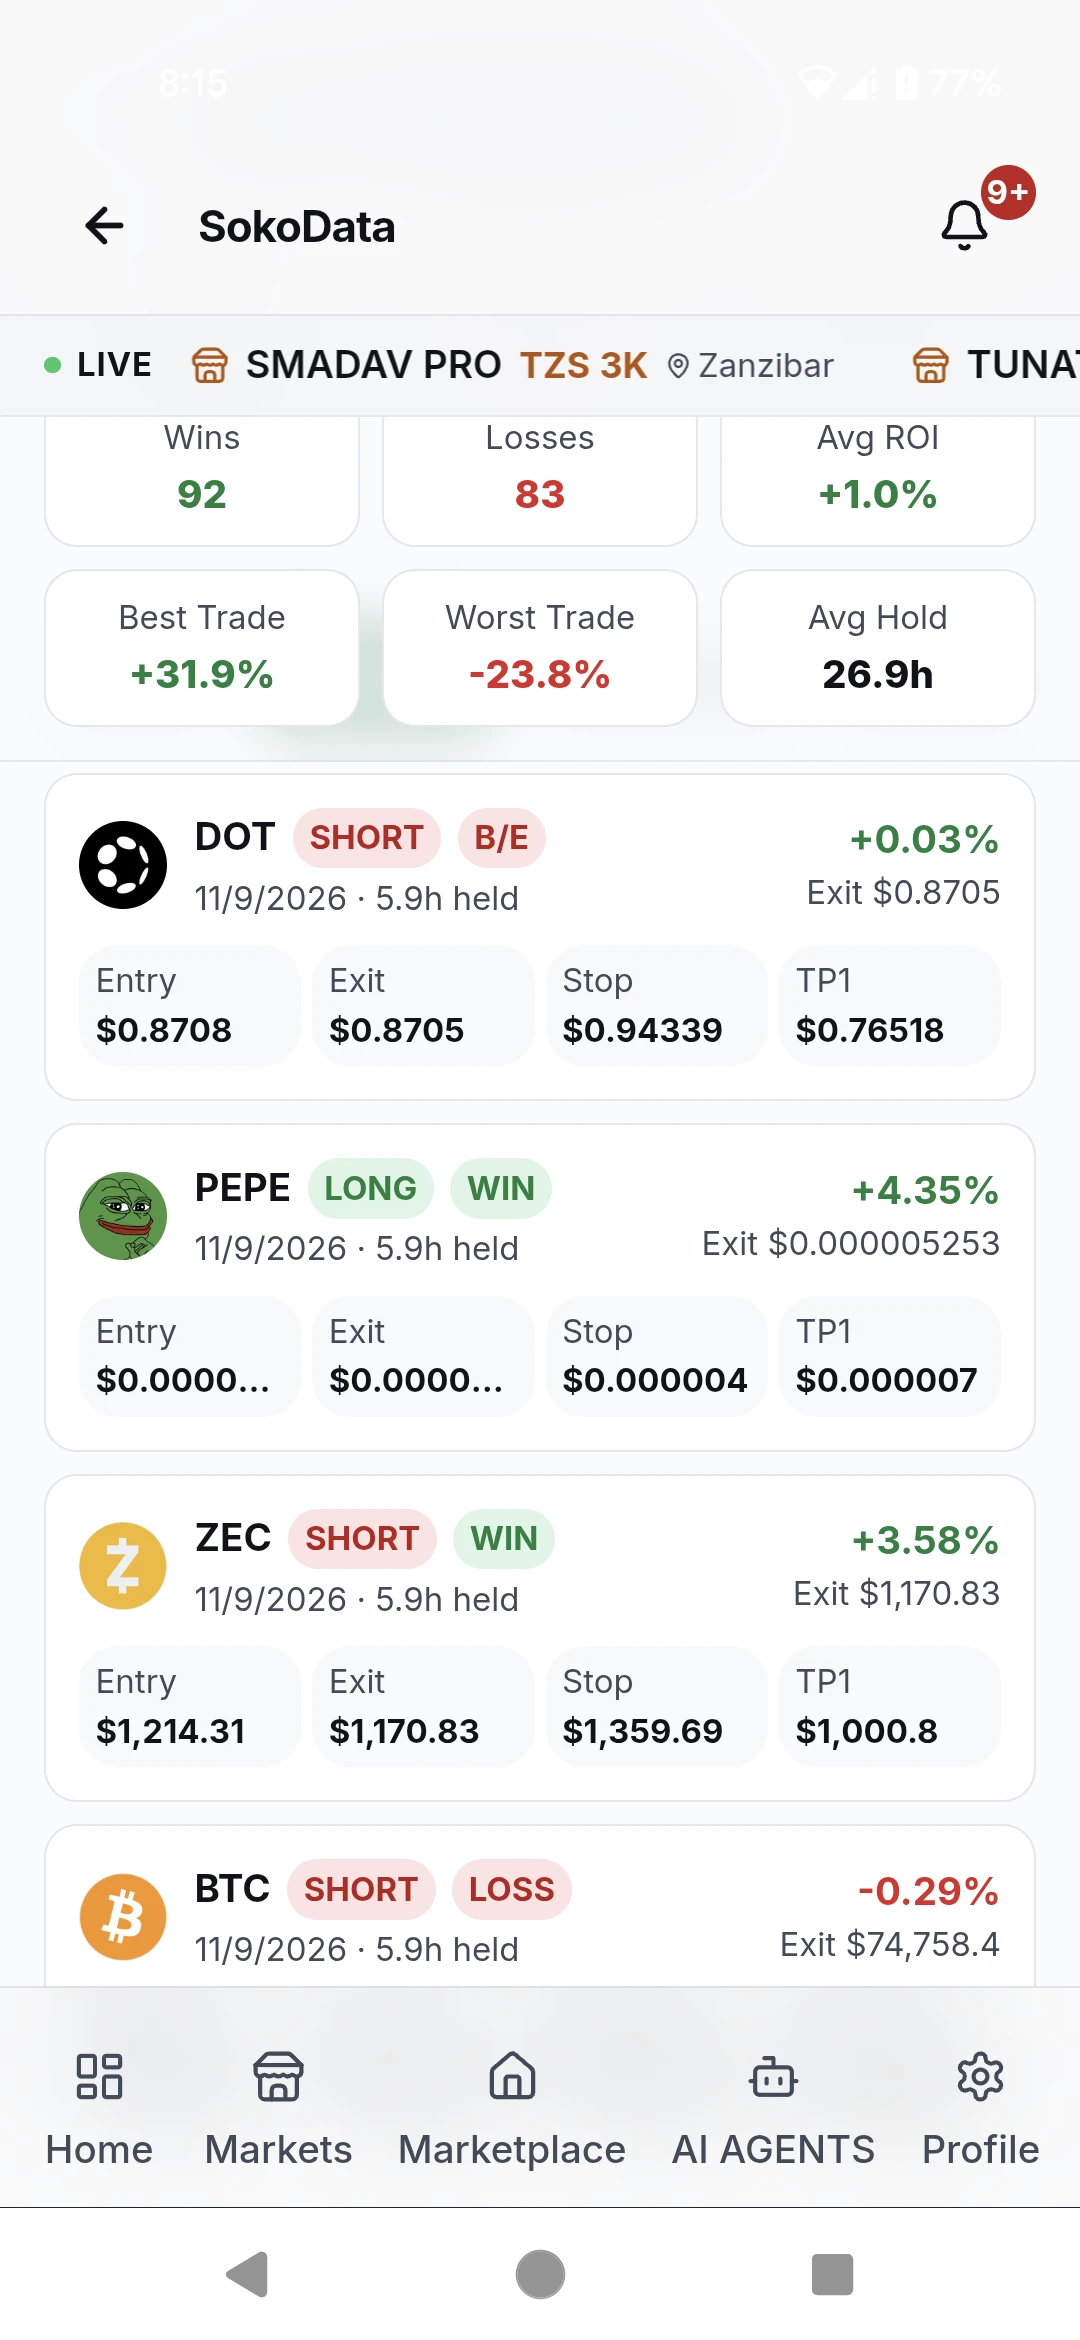
NO HIDING THE LOSSES: A RAW LOOK INSIDE MY RECENT TRADE BATCH. 📊

Let’s be real for a second. Trading isn't about winning 100% of the time; it’s about managing risk and letting the math play out over time. I’m pulling back the curtain to show you my actual recent stats on SokoData so you can see exactly how this works.

Here is the overall performance breakdown:
· Wins: 92
· Losses: 83
· Avg ROI: +1.0%
· Best Trade: +31.9%
· Worst Trade: -23.8%
· Avg Hold: 26.9h

This is what actual trading looks like. You take hits, but you manage them. Now, let's break down the recent batch of trades execut
post-image
PEPE+1.05%
  • 1
CHAINLINK STUCK IN THE MUD: BEARISH STRUCTURE CONFIRMED! 📉
$LINK ‌
Do not try to force a long here. Chainlink is currently bleeding slowly, sitting at $10.59 after a -1.10% drop. The overall Market Structure has officially flipped to Bearish, and the market is practically asleep.

Let’s look at the exact data before you make a move:

📊 The Market Overview:
· Market Cap: $8.12B
· Volume Change: 4% of Mkt Cap (Very low activity).
· Open Interest (OI) Change: -1.5%
· Funding Rate: -1.0000% (Long/Short ratio is 0.89x).
· Volatility Score: 13/100 (Dead quiet).
· Liquidity Score: 72/100.

🐋 Whal
LINK-0.19%
  • 1
ETHEREUM BLEEDING OUT: WHALES ARE DUMPING AND A LONG SQUEEZE IS BREWING! 📉
$ETH ‌
Do not try to catch this falling knife. Ethereum is currently getting hammered, sitting at $2,116 after a sharp -5.34% drop. The entire Market Structure has officially flipped to Bearish, and the underlying metrics are screaming danger.

Let’s look at the cold, hard facts before you even think about clicking that buy button:

📊 The Market Overview:
· Market Cap: $258.55B
· Volume Change: 6% of Mkt Cap
· Open Interest (OI) Change: -4.8% (Money is fleeing the market).
· Funding Rate: -1.0000% (Long/Short ratio i
ETH-1.23%
I FINALLY PAID FOR PREMIUM! HERE IS WHAT IS INSIDE AND WHY IT WILL SAVE YOUR CRYPTO PORTFOLIO. 🔥
$ARB ‌
Listen up, traders. I just pulled the trigger and invested in the Improved Crypto and Forex Insights membership. Look at my screenshot—it is officially active until 11/10/2026.

Many people see the price tag (3 USDT for 24 hours, 15 USDT for 7 days, or 45 USDT for 30 days) and hesitate. But let me show you exactly what unlocks the moment you pay:

1. Bitcoin Forecast Engine: You get daily, weekly, monthly, and quarterly Bitcoin predictions. Right now, it is flashing a Bearish outlook at $7
ARB+1.20%
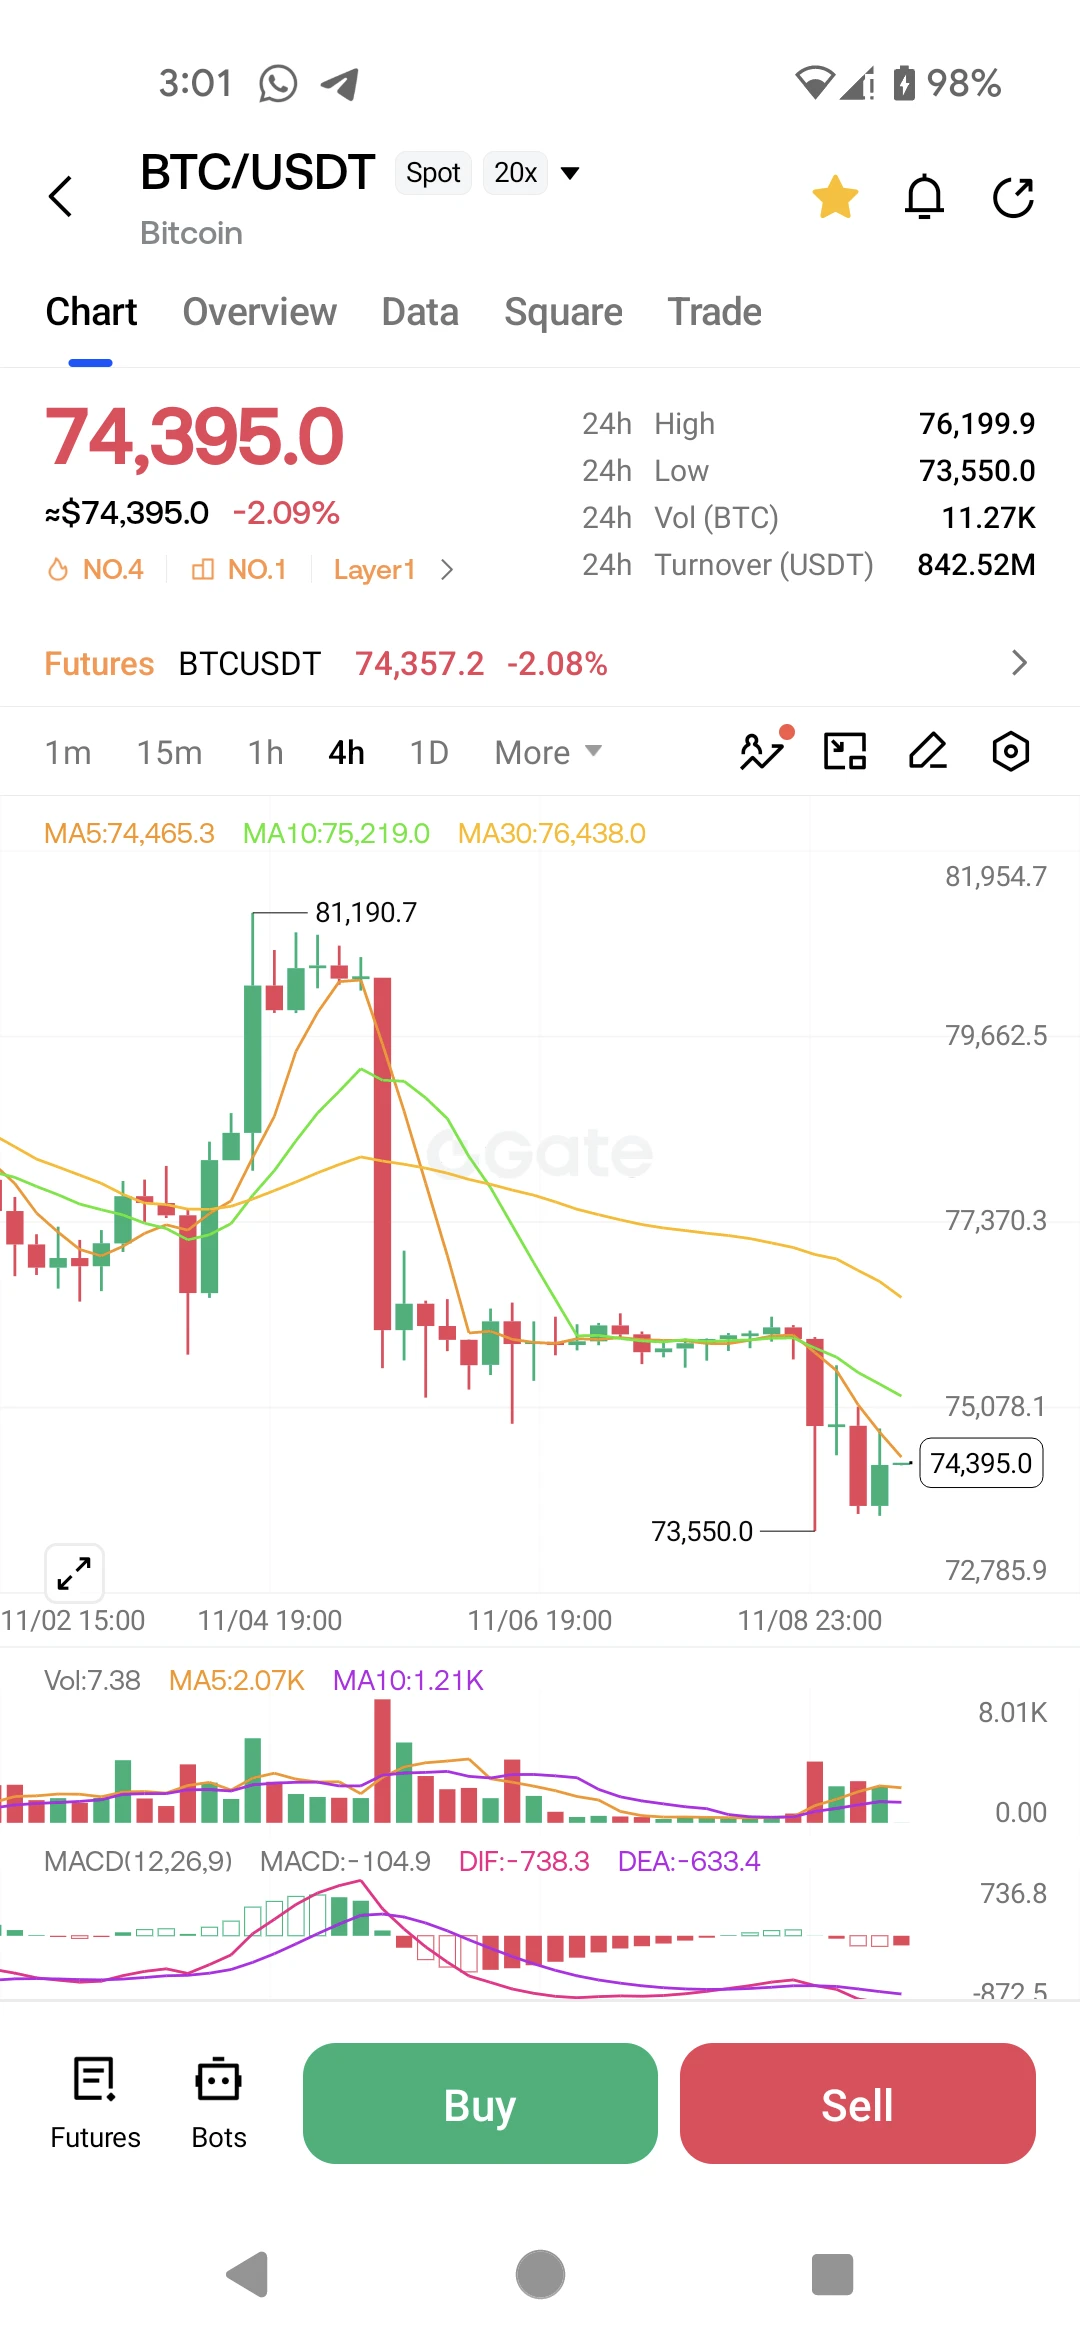
$BTC ‌ SHORT: Bitcoin has completely lost its footing, and the market structure signals the bears are in full control for another leg down.

Trading Plan Short BTC
Entry: 74,200.00 - 74,600.00
SL: 76,500.00
TP1: 73,550.00
TP2: 72,000.00
TP3: 70,500.00

BTC is down 2.09% today at $74,395.0, reeling from a sharp rejection after the failed rally to $81,190.7. The 4-hour chart is decisively bearish. Price is trading well beneath all three key moving averages: MA5 at $74,465.3, MA10 at $75,219.0, and the MA30 sitting high at $76,438.0. This cascading alignment is a textbook setup for continued sel
post-image
BTC-0.65%
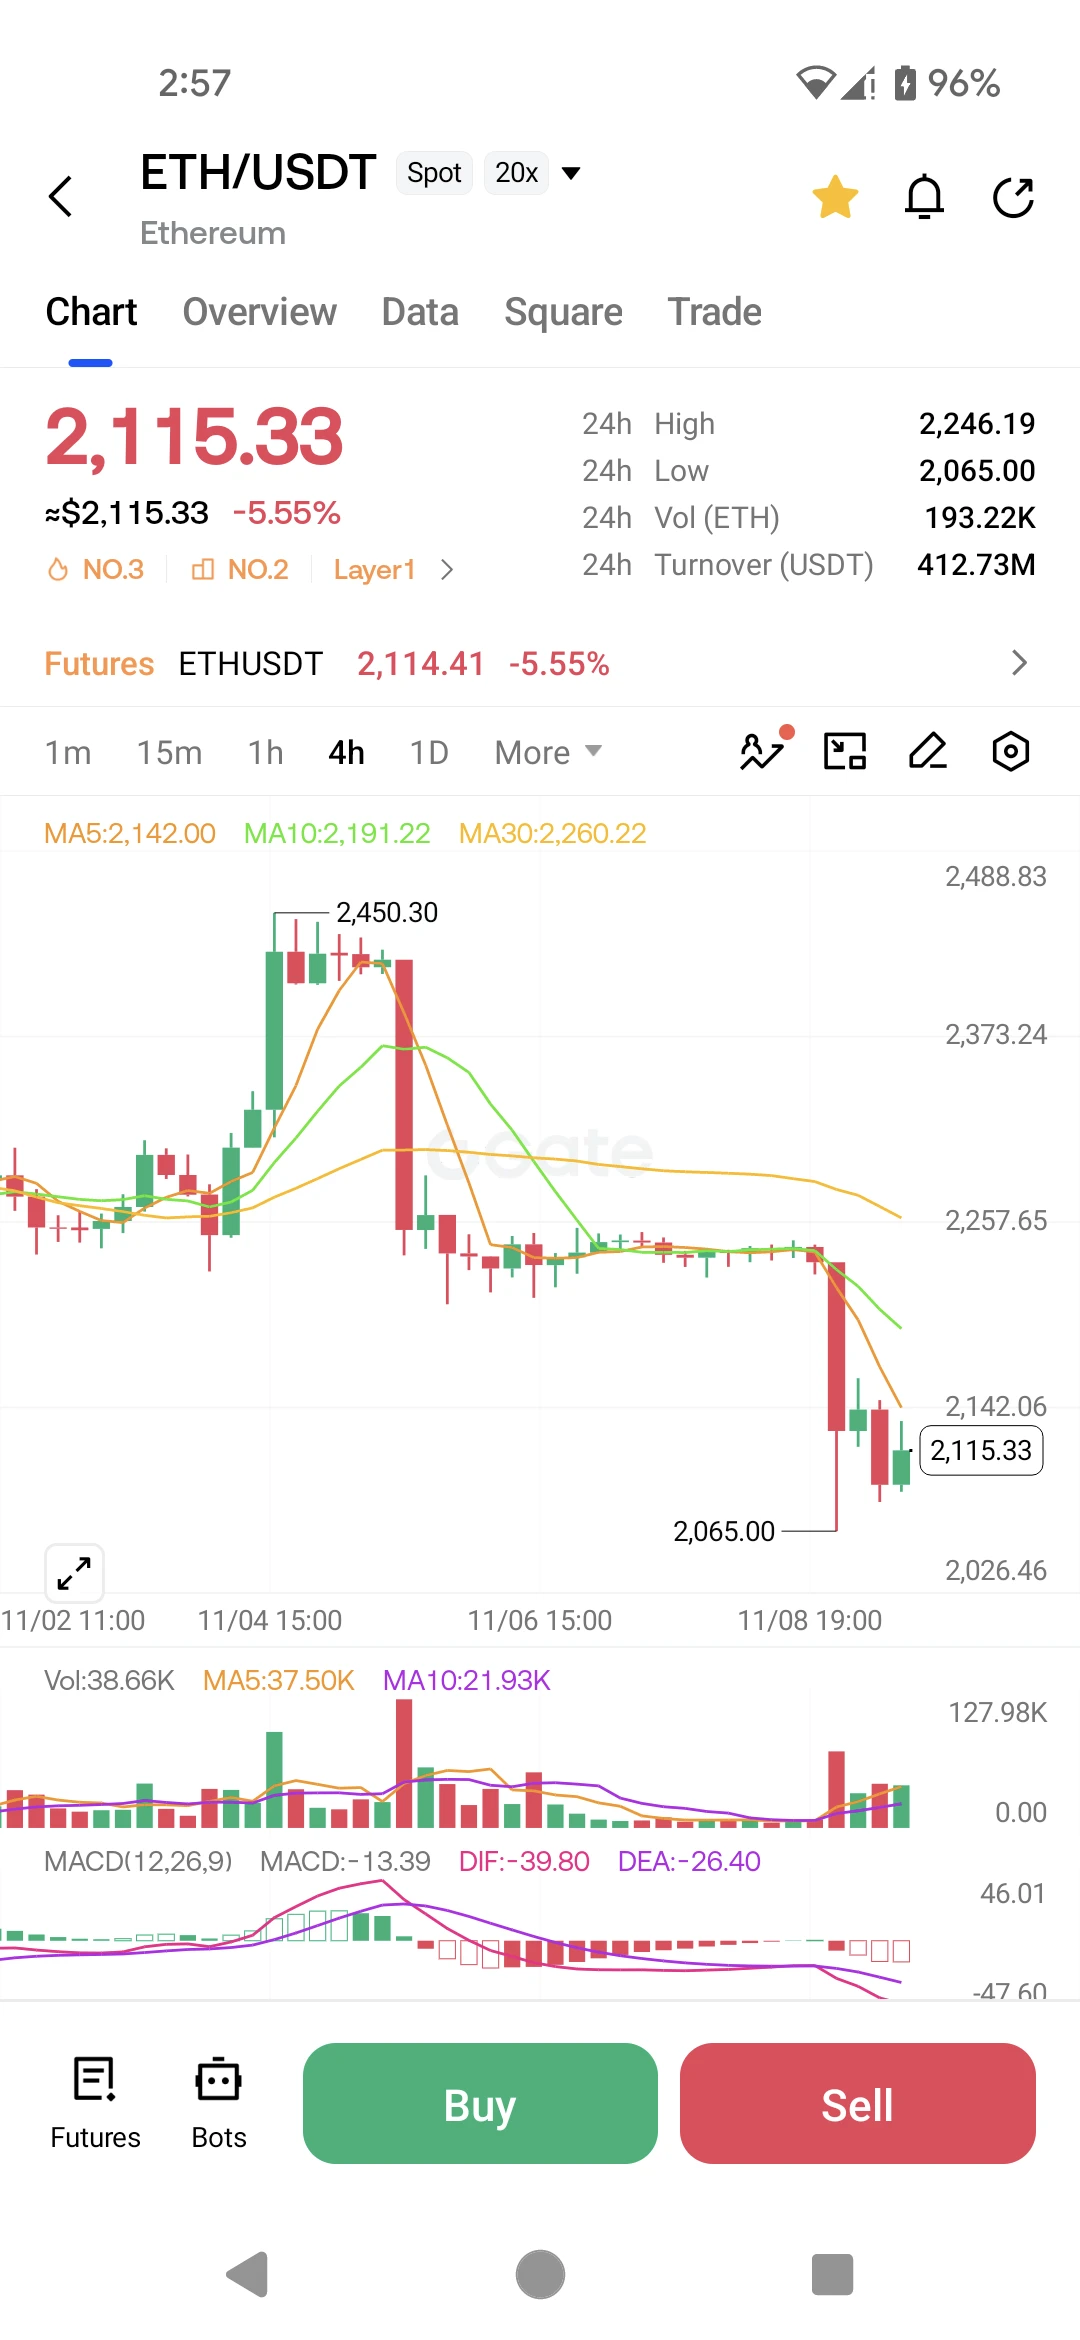
$ETH ‌SHORT: Ethereum is in a state of freefall, and the recent price action shows a complete capitulation of the bullish structure.

Trading Plan Short ETH
Entry: 2,110.00 - 2,130.00
SL: 2,200.00
TP1: 2,065.00
TP2: 2,020.00
TP3: 1,950.00

ETH is down a massive 5.55% today at $2,115.33, and the 4-hour chart is incredibly ugly for the bulls. Price has absolutely plummeted from the $2,450.30 high, slicing straight through all major moving averages. It currently sits far below the MA5 at $2,142.00, the MA10 at $2,191.22, and the MA30 at $2,260.22. This is a violent, wide-open bearish stack.

The
post-image
ETH-1.23%
Load More