For crypto traders dealing with short-term price fluctuations, building this plan before entering trades helps reduce impulsive decisions, control potential losses, and identify opportunities that match current market conditions.
Key Takeaways
-
An intraday trading strategy should define market conditions, entry triggers, stop-loss levels, profit targets, and position sizes before execution.
-
Breakout trading, momentum trading, range trading, and reversal trading work under different volatility and trend conditions.
-
Technical indicators such as moving averages, VWAP, RSI, and volume can help confirm setups, but cannot guarantee successful trades.
-
Backtesting, paper trading, and daily loss limits help traders evaluate strategies and manage risk before committing capital.
What Is an Intraday Trading Strategy?
An intraday trading strategy is a set of trading rules designed to capture short-term price movements without intentionally holding positions overnight.
Unlike swing trading, where positions may remain open for several days, intraday trading focuses on opportunities developing during a single trading session. Traders generally close positions before the market closes. Cryptocurrency markets operate around the clock, so crypto day traders must define their own session boundaries.
Intraday trading offers opportunities in crypto, the stock market, and the forex market. Yet price fluctuations, spreads, fees, and sudden reversals can quickly turn promising setups into losing trades.
The objective isn't to execute numerous trades. It's to identify repeatable conditions where potential rewards justify the risks involved.
How to Build an Intraday Trading Strategy Step by Step
Step 1: Identify Market Direction and Volatility
Start with the overall trend before analyzing individual entry signals.
A market forming higher highs and higher lows generally indicates bullish momentum. Lower highs and lower lows suggest bearish pressure. Sideways markets require a different approach because prices repeatedly move between support and resistance.
Using multiple timeframes in crypto trading helps distinguish broader market trends from temporary price corrections.
For example, an intraday trader might use:
-
1-hour chart: Identify the prevailing trend.
-
15-minute chart: Locate support, resistance, and potential setups.
-
5-minute chart: Evaluate entry confirmation.
Volatility matters too. Average True Range (ATR) estimates the scale of recent price movements, helping traders decide whether their stop-loss distance and position size remain appropriate.
Step 2: Select Suitable Day Trading Strategies
The best day trading strategies depend on market conditions rather than a universal indicator combination.
| Intraday Strategy |
Suitable Conditions |
Main Trading Idea |
| Breakout trading |
Expanding volatility |
Enter after price breaks a key level |
| Momentum trading |
Strong directional movement |
Follow accelerating price moves |
| Range trading |
Sideways markets |
Trade reactions near support and resistance |
| Reversal trading |
Exhausted or overextended moves |
Seek price corrections |
| Scalping |
Liquid markets with manageable costs |
Capture small movements through frequent trades |
| Mean reversion |
Range-bound or temporarily stretched prices |
Trade a potential return toward an average |
For beginners, learning one or two intraday strategies is generally more manageable than combining numerous technical indicators.
Opening range breakout (ORB) is a common example in stock trading. Breakout traders observe the initial trading period after the market opens and consider entering when a stock breaks its opening range with supporting volume.
The Gap and Go strategy similarly focuses on stocks that open significantly above or below their previous closing price. These strategies depend on market opening mechanics and don't translate directly into 24-hour cryptocurrency trading.
In crypto, session breakout trading can use defined Asian, London, or New York trading periods to identify comparable breakout conditions.
Step 3: Mark Entry and Exit Levels Before Trading
Every intraday strategy needs a specific reason for entering a trade.
Start by marking support, where buyers have previously responded, and resistance, where sellers have previously limited price rises.
A validated support or resistance level becomes more useful when historical price reactions, trading volume, and market structure support its significance.
For a potential long position, the trader might require:
-
Price breaks above a resistance level.
-
Trading volume increases during the breakout.
-
Price successfully retests the broken level.
-
A confirmation candle establishes the entry trigger.
The same logic can be reversed for a short position where the trading instrument permits short selling.
A breakout isn't automatically valid because price briefly crosses a level. False breakouts occur when price moves beyond support or resistance but quickly returns inside the previous range.
Step 4: Choose Technical Indicators for Confirmation
Technical indicators should answer specific questions rather than produce conflicting signals.
A moving average smooths price fluctuations to show directional movement. The Volume Weighted Average Price (VWAP) represents the average traded price weighted by volume over a defined period.
For example, an EMA and VWAP pullback strategy can identify situations where price remains above session VWAP while briefly retracing toward a rising exponential moving average.
RSI or MACD may help assess short-term momentum. Meanwhile, volume and price analysis helps determine whether buying or selling activity supports the observed movement.
Bollinger Bands can identify prices that are stretched relative to their recent average, although touching a band alone does not establish an overbought or oversold reversal.
Two complementary indicators are often easier to interpret than five measuring similar conditions.
Step 5: Define Intraday Trading Rules and Risk Limits
Risk management determines how much capital a trader could lose when an entry fails.
A trading plan should establish maximum risk per position, stop-loss placement, profit targets, and a daily loss limit.
Consider a hypothetical account containing $5,000.
| Risk Parameter |
Illustrative Value |
| Trading capital |
$5,000 |
| Risk per trade |
1% |
| Maximum planned trade loss |
$50 |
| Entry price |
$100 |
| Stop-loss price |
$98 |
| Risk per unit |
$2 |
| Position size |
25 units |
| Profit target |
$104 |
| Planned reward-to-risk ratio |
2:01 |
Position size = Maximum planned risk ÷ Entry-to-stop distance
Here, $50 ÷ $2 = 25 units.
The $104 target represents a potential $100 gross profit against $50 planned risk. These figures exclude fees, slippage, and funding costs. Actual losses can exceed planned limits if stops execute at unfavorable prices.
A trader examining the BTC/USDT spot market on Gate.com can use live price structure and available order information to evaluate hypothetical entries without assuming that current prices guarantee execution.
Step 6: Prepare a Pre-Trade Checklist
Before entering trades, an intraday trader should answer six questions:
-
Does the selected strategy match the current market trend and volatility?
-
Is the entry supported by price action and volume?
-
Where will the trade become invalid?
-
Is the profit target realistic relative to nearby resistance or support?
-
Does the position size respect the risk limit?
-
Are major economic data releases or news events approaching?
An economic calendar can help identify scheduled announcements that may increase volatility. News based trading requires additional caution because price gaps and slippage can make execution unpredictable.
If the answers are unclear, avoiding the trade may be more disciplined than forcing an entry.
How Day Traders Can Test Intraday Strategies
Backtesting evaluates how trading rules would have performed using historical market data. Paper trading or a demo account provides an opportunity to observe the strategy under simulated conditions.
A useful trading journal records entry and exit prices, market conditions, position size, fees, reasons for entering, and whether the rules were followed.
Compare performance across trending, sideways, and volatile sessions. A strategy that works during strong momentum may struggle when price repeatedly reverses around VWAP.
Historical results can also overstate performance when testing ignores spread, slippage, liquidity, and execution delays.
Day Trading Tips: Common Risks and Mistakes
Day trading creates opportunities, but repeated transactions also increase costs and potential losses.
The U.S. Securities and Exchange Commission warns that day trading can generate substantial financial losses, particularly when leverage is involved.
Common mistakes include chasing price movements, moving stop-loss orders farther away, taking revenge trades after losses, and increasing exposure during unexpected volatility.
The Financial Industry Regulatory Authority also highlights frequent trading costs, margin exposure, and the need to understand brokerage requirements.
For leveraged instruments, the CFTC's forex risk advisory illustrates how margin can magnify losses. The same general leverage concern applies to crypto derivatives, although market structures and legal requirements differ.
Stopping after a predefined daily loss limit helps prevent losing trades from developing into emotional decision-making.
Conclusion
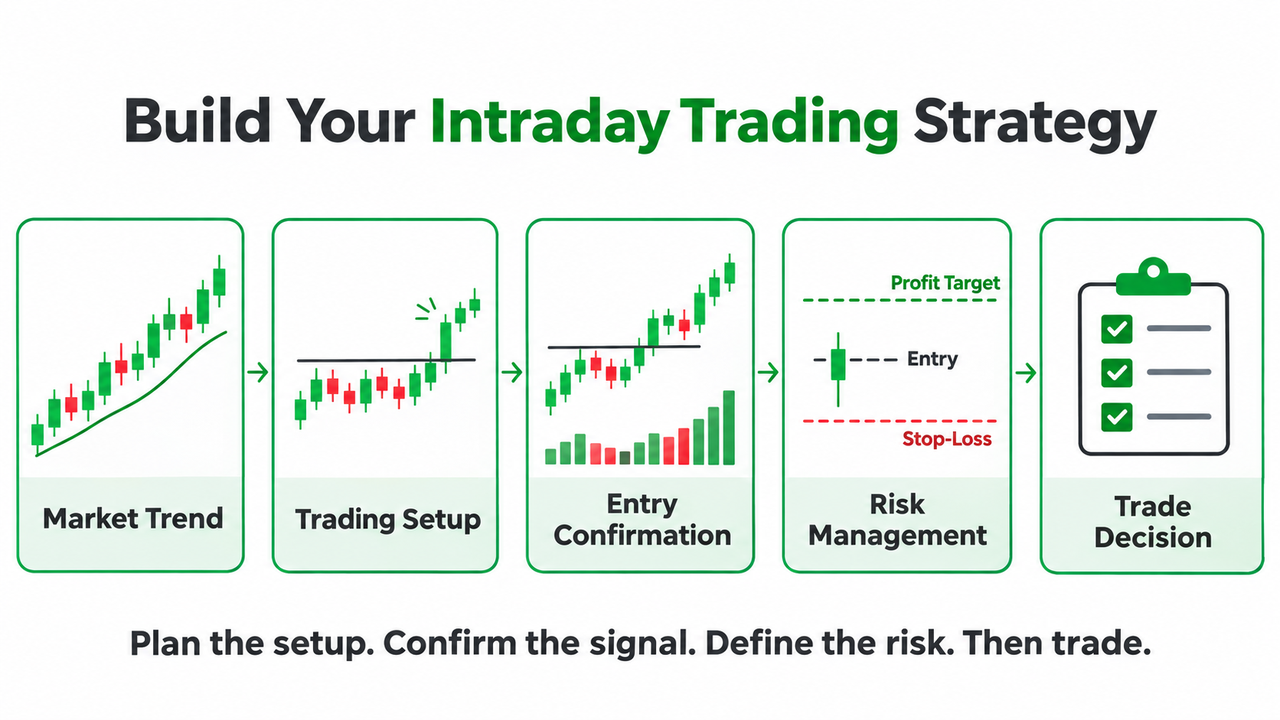
A practical intraday trading strategy begins before an order reaches the trading platform. Market conditions determine the setup, technical confirmation helps evaluate the entry, and predefined risk limits establish when to exit.
Successful intraday trading cannot be reduced to one indicator or a fixed win rate. Clear rules, repeatable execution, and adjustments for changing volatility provide a more disciplined framework, although losses remain unavoidable possibilities.
Frequently Asked Questions
What is the best intraday trading strategy for beginners?
Simple breakout or trend-following strategies with clearly defined entries, stop-loss levels, and profit targets are useful starting points for study. Beginners should test them through paper trading before risking capital.
How many indicators should day traders use?
Two or three complementary indicators may be sufficient. For example, a moving average can identify direction, VWAP can provide session context, and volume can help evaluate participation.
Can intraday trading be profitable every day?
No. Even well-tested trading strategies experience losing trades and unfavorable market conditions. Profitability depends on performance after trading costs, execution quality, and risk management.
Is intraday trading suitable for cryptocurrency markets?
Yes, crypto markets support intraday trading because many pairs trade continuously. However, liquidity, volatility, exchange access, leverage restrictions, and execution conditions vary by asset and jurisdiction.
Why is paper trading important before day trading?
Paper trading allows traders to practice execution, evaluate their strategy, and identify mistakes without putting real capital at risk. Simulated performance may differ from live results because of slippage, market impact, and emotional pressure.
Disclaimer: Cryptocurrency trading involves substantial financial risk. Technical indicators, backtesting results, and trading strategies cannot guarantee future performance. Conduct independent research and assess your financial circumstances and risk tolerance before trading.